|
|
|
||||||||
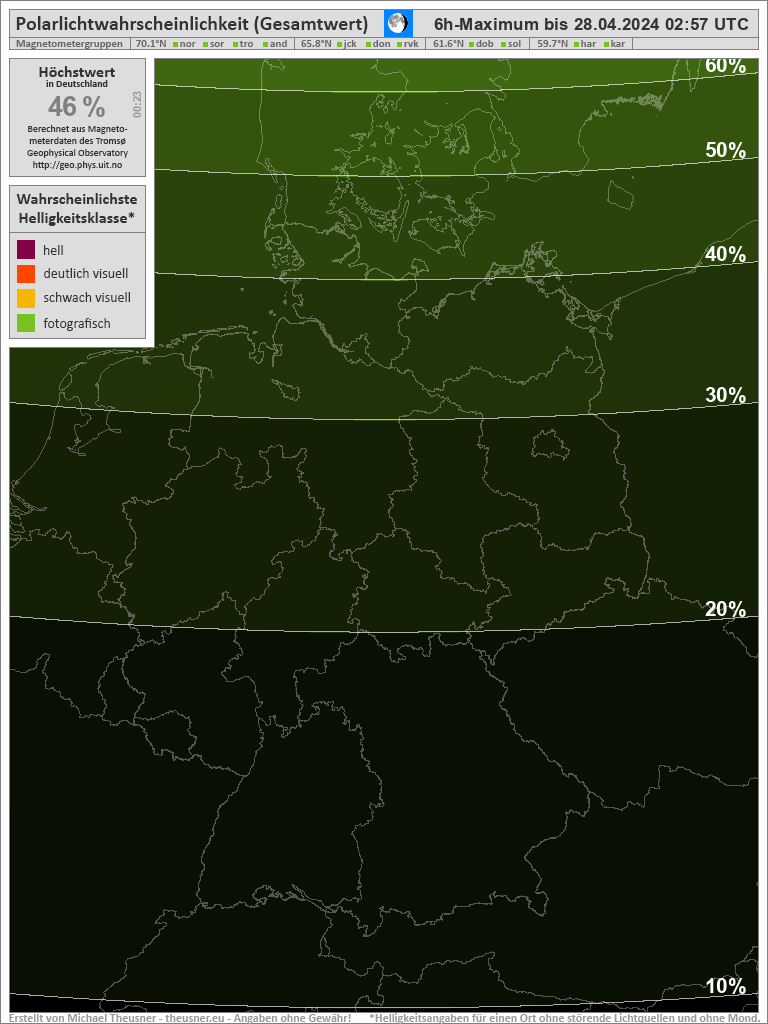
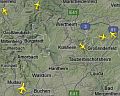
The picture below shows the present Aurora
probability in Europe.
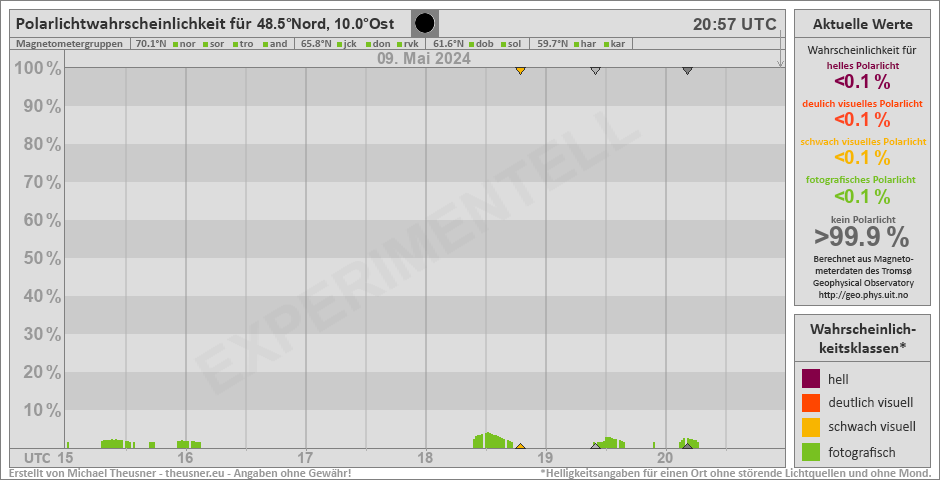
Below you can find the probability that you
can see an Aurora at my latitude of 48.5 degree North
Schedule of Astronomy related Television transmission of NASA:
|
||||||||||


